Reading data and plotting#
Reading from files is the far more standard way to use pandas.
To facilitate this, DataFrame accessors are provided to make it easy to get to PintArray objects.
Read data from csv#
First some imports
In [1]: import pandas as pd

In [2]: import pint

In [3]: import pint_pandas

In [4]: import io
Here’s the contents of the csv file.
In [5]: test_data = """ShaftSpeedIndex,rpm,1200,1200,1200,1600,1600,1600,2300,2300,2300
   ...: pump,,A,B,C,A,B,C,A,B,C
   ...: TestDate,No Unit,01/01,01/01,01/01,01/01,01/01,01/01,01/02,01/02,01/02
   ...: ShaftSpeed,rpm,1200,1200,1200,1600,1600,1600,2300,2300,2300
   ...: FlowRate,m^3 h^-1,8.72,9.28,9.31,11.61,12.78,13.51,18.32,17.90,19.23
   ...: DifferentialPressure,kPa,162.03,144.16,136.47,286.86,241.41,204.21,533.17,526.74,440.76
   ...: ShaftPower,kW,1.32,1.23,1.18,3.09,2.78,2.50,8.59,8.51,7.61
   ...: Efficiency,dimensionless,30.60,31.16,30.70,30.72,31.83,31.81,32.52,31.67,32.05"""
   ...:
Let’s read that into a DataFrame. Here io.StringIO is used in place of reading a file from disk, whereas a csv file path would typically be used and is shown commented.
In [6]: df = pd.read_csv(io.StringIO(test_data), header=[0, 1], index_col=[0, 1]).T

# df = pd.read_csv("/path/to/test_data.csv", header=[0, 1])
In [7]: for col in df.columns:
   ...:     try:
   ...:         df[col] = pd.to_numeric(df[col])
   ...:     except ValueError:
   ...:         pass
   ...:

In [8]: df.dtypes
Out[8]:
TestDate              No Unit           object
ShaftSpeed            rpm                int64
FlowRate              m^3 h^-1         float64
DifferentialPressure  kPa              float64
ShaftPower            kW               float64
Efficiency            dimensionless    float64
dtype: object
Pandas DataFrame Accessors#
Then use the DataFrame’s pint accessor’s quantify method to convert the columns from ndarray to PintArray, with units from the bottom column level.
Using ‘No Unit’ as the unit will prevent quantify converting a column to a PintArray. This can be changed by changing pint_pandas.pint_array.NO_UNIT.
In [9]: df_ = df.pint.quantify(level=-1)

In [10]: df_
Out[10]:
                     TestDate  ShaftSpeed  ...  ShaftPower  Efficiency
ShaftSpeedIndex pump                       ...
1200            A       01/01        1200  ...        1.32        30.6
                B       01/01        1200  ...        1.23       31.16
                C       01/01        1200  ...        1.18        30.7
1600            A       01/01        1600  ...        3.09       30.72
                B       01/01        1600  ...        2.78       31.83
                C       01/01        1600  ...         2.5       31.81
2300            A       01/02        2300  ...        8.59       32.52
                B       01/02        2300  ...        8.51       31.67
                C       01/02        2300  ...        7.61       32.05

[9 rows x 6 columns]
Let’s confirm the units have been parsed correctly by looking at the dtypes.
In [11]: df_.dtypes
Out[11]:
TestDate                                             object
ShaftSpeed              pint[revolutions_per_minute][int64]
FlowRate                   pint[meter ** 3 / hour][float64]
DifferentialPressure              pint[kilopascal][float64]
ShaftPower                          pint[kilowatt][float64]
Efficiency                     pint[dimensionless][float64]
dtype: object
Here the Efficiency has been parsed as dimensionless. Let’s change it to percent.
In [12]: df_["Efficiency"] = pint_pandas.PintArray(
   ....:     df_["Efficiency"].values.quantity.m, dtype="pint[percent]"
   ....: )
   ....:

In [13]: df_.dtypes
Out[13]:
TestDate                                             object
ShaftSpeed              pint[revolutions_per_minute][int64]
FlowRate                   pint[meter ** 3 / hour][float64]
DifferentialPressure              pint[kilopascal][float64]
ShaftPower                          pint[kilowatt][float64]
Efficiency                           pint[percent][Float64]
dtype: object
As previously, operations between DataFrame columns are unit aware
In [14]: df_.ShaftPower / df_.ShaftSpeed
Out[14]:
ShaftSpeedIndex  pump
1200             A                      0.0011
                 B                    0.001025
                 C       0.0009833333333333332
1600             A       0.0019312499999999998
                 B                   0.0017375
                 C                   0.0015625
2300             A        0.003734782608695652
                 B       0.0036999999999999997
                 C       0.0033086956521739133
dtype: pint[kilowatt / revolutions_per_minute][float64]

In [15]: df_["ShaftTorque"] = df_.ShaftPower / df_.ShaftSpeed

In [16]: df_["FluidPower"] = df_["FlowRate"] * df_["DifferentialPressure"]

In [17]: df_
Out[17]:
                     TestDate  ...          FluidPower
ShaftSpeedIndex pump           ...
1200            A       01/01  ...  1412.9016000000001
                B       01/01  ...           1337.8048
                C       01/01  ...  1270.5357000000001
1600            A       01/01  ...           3330.4446
                B       01/01  ...           3085.2198
                C       01/01  ...           2758.8771
2300            A       01/02  ...           9767.6744
                B       01/02  ...   9428.645999999999
                C       01/02  ...           8475.8148

[9 rows x 8 columns]

In [18]: df_.groupby(by=["ShaftSpeedIndex"])[['FlowRate', 'DifferentialPressure', 'ShaftPower', 'Efficiency']].mean()
Out[18]:
                           FlowRate  ...          Efficiency
ShaftSpeedIndex                      ...
1200              9.103333333333333  ...  30.820000000000004
1600             12.633333333333333  ...  31.453333333333333
2300             18.483333333333334  ...  32.080000000000005

[3 rows x 4 columns]
The DataFrame’s pint.dequantify method then allows us to retrieve the units information as a header row once again.
In [19]: df_.pint.dequantify()
Out[19]:
                     TestDate  ...                     FluidPower
unit                  No Unit  ... kilopascal * meter ** 3 / hour
ShaftSpeedIndex pump           ...
1200            A       01/01  ...                      1412.9016
                B       01/01  ...                      1337.8048
                C       01/01  ...                      1270.5357
1600            A       01/01  ...                      3330.4446
                B       01/01  ...                      3085.2198
                C       01/01  ...                      2758.8771
2300            A       01/02  ...                      9767.6744
                B       01/02  ...                      9428.6460
                C       01/02  ...                      8475.8148

[9 rows x 8 columns]
This allows for some rather powerful abilities. For example, to change a column’s units
In [20]: df_["FluidPower"] = df_["FluidPower"].pint.to("kW")

In [21]: df_["FlowRate"] = df_["FlowRate"].pint.to("L/s")

In [22]: df_["ShaftTorque"] = df_["ShaftTorque"].pint.to("N m")

In [23]: df_.pint.dequantify()
Out[23]:
                     TestDate             ShaftSpeed  ...    ShaftTorque FluidPower
unit                  No Unit revolutions_per_minute  ... meter * newton   kilowatt
ShaftSpeedIndex pump                                  ...
1200            A       01/01                   1200  ...      10.504226   0.392473
                B       01/01                   1200  ...       9.788029   0.371612
                C       01/01                   1200  ...       9.390142   0.352927
1600            A       01/01                   1600  ...      18.442079   0.925123
                B       01/01                   1600  ...      16.591903   0.857005
                C       01/01                   1600  ...      14.920776   0.766355
2300            A       01/02                   2300  ...      35.664547   2.713243
                B       01/02                   2300  ...      35.332397   2.619068
                C       01/02                   2300  ...      31.595716   2.354393

[9 rows x 8 columns]
The units are harder to read than they need be, so lets change pint’s default format for displaying units.
In [24]: pint_pandas.PintType.ureg.formatter.default_format = "P~"

In [25]: df_.pint.dequantify()
Out[25]:
                     TestDate ShaftSpeed  ... ShaftTorque FluidPower
unit                  No Unit        rpm  ...         m·N         kW
ShaftSpeedIndex pump                      ...
1200            A       01/01       1200  ...   10.504226   0.392473
                B       01/01       1200  ...    9.788029   0.371612
                C       01/01       1200  ...    9.390142   0.352927
1600            A       01/01       1600  ...   18.442079   0.925123
                B       01/01       1600  ...   16.591903   0.857005
                C       01/01       1600  ...   14.920776   0.766355
2300            A       01/02       2300  ...   35.664547   2.713243
                B       01/02       2300  ...   35.332397   2.619068
                C       01/02       2300  ...   31.595716   2.354393

[9 rows x 8 columns]
or the entire table’s units
In [26]: df_.pint.to_base_units().pint.dequantify()
Out[26]:
                     TestDate ShaftSpeed  ... ShaftTorque   FluidPower
unit                  No Unit      rad/s  ...    kg·m²/s²     kg·m²/s³
ShaftSpeedIndex pump                      ...
1200            A       01/01        125  ...   10.504226   392.472667
                B       01/01        125  ...    9.788029   371.612444
                C       01/01        125  ...    9.390142   352.926583
1600            A       01/01        167  ...   18.442079   925.123500
                B       01/01        167  ...   16.591903   857.005500
                C       01/01        167  ...   14.920776   766.354750
2300            A       01/02        240  ...   35.664547  2713.242889
                B       01/02        240  ...   35.332397  2619.068333
                C       01/02        240  ...   31.595716  2354.393000

[9 rows x 8 columns]
Plotting#
Pint’s matplotlib support allows columns with the same dimensionality to be plotted. First, set up matplotlib to use pint’s units.
In [27]: import matplotlib.pyplot as plt

In [28]: pint_pandas.PintType.ureg.setup_matplotlib()
Let’s convert a column to a different unit and plot two columns with different units. Pint’s matplotlib support will automatically convert the units to the first units and add the units to the axis labels.
In [29]: df_['FluidPower'] = df_['FluidPower'].pint.to('W')

In [30]: df_[["ShaftPower", "FluidPower"]].dtypes
Out[30]:
ShaftPower    pint[kW][float64]
FluidPower     pint[W][float64]
dtype: object

In [31]: fig, ax = plt.subplots()

In [32]: ax = df_[["ShaftPower", "FluidPower"]].unstack("pump").plot(ax=ax)
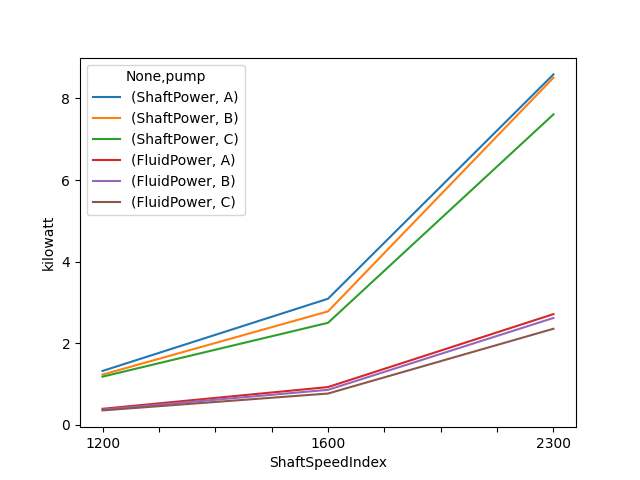
In [33]: ax.yaxis.units
Out[33]: <Unit('kilowatt')>

In [34]: ax.yaxis.label
Out[34]: Text(55.847222222222214, 0.5, 'kilowatt')
Single row headers#
A parsing function can be passed into df.pint.quantify to handle single row headers.
In [35]: df = pd.DataFrame(
   ....:     {
   ....:         "no_unit_column": pd.Series([i for i in range(4)], dtype="Float64"),
   ....:         "torque [lbf ft]": pd.Series([1.0, 2.0, 2.0, 3.0], dtype="Float64"),
   ....:     }
   ....: )
   ....:

In [36]: def parsing_function(column_name):
   ....:     if "[" in column_name:
   ....:         return column_name.split("]")[0].split(" [")
   ....:     return column_name, pint_pandas.pint_array.NO_UNIT
   ....:

In [37]: df.pint.quantify(parsing_function=parsing_function)
Out[37]:
   no_unit_column  torque
0             0.0     1.0
1             1.0     2.0
2             2.0     2.0
3             3.0     3.0
Alternatively df.pint.quantify() will attempt to parse single row headers that adhere to the following formats:
{column_name} [{unit}]{column_name} ({unit}){column_name} / {unit}
In [38]: df = pd.DataFrame(
   ....:     {
   ....:         "no_unit_column": pd.Series([i for i in range(4)], dtype="Float64"),
   ....:         "torque [lbf ft]": pd.Series([1.0, 2.0, 2.0, 3.0], dtype="Float64"),
   ....:     }
   ....: )
   ....:

In [39]: df_ = df.pint.quantify()

In [40]: df_
Out[40]:
   no_unit_column  torque
0             0.0     1.0
1             1.0     2.0
2             2.0     2.0
3             3.0     3.0
The reverse operation can be done with df.pint.dequantify() and the writing_function argument.
In [41]: df_.pint.dequantify()
Out[41]:
   no_unit_column  torque [ft·lbf]
0             0.0              1.0
1             1.0              2.0
2             2.0              2.0
3             3.0              3.0

In [42]: def writing_function(column_name, unit):
   ....:     if unit == pint_pandas.pint_array.NO_UNIT:
   ....:         return column_name
   ....:     return f"{column_name} [{unit}]"
   ....:

In [43]: df_.pint.dequantify(writing_function=writing_function)
Out[43]:
   no_unit_column  torque [ft·lbf]
0             0.0              1.0
1             1.0              2.0
2             2.0              2.0
3             3.0              3.0